



The Translator Every HDR Display Needs: What Tone Mapping Actually Does
HDR content is mastered against a reference — often up to 10,000 nits of peak brightness under the PQ transfer function HDR10+ uses. Almost no consumer display can actually hit that number. Tone mapping is the process that reconciles the two: translating what a scene was mastered to look like into what a specific display can actually produce, without simply clipping everything above its limit to flat white.
Why you can’t just “clip” the signal
The simplest possible approach would be to show every brightness level a display can reproduce accurately, and clip anything brighter than that to pure white. That’s exactly what tone mapping is designed to avoid. Clipping destroys detail — a sunset’s graduated colors, a bright window’s texture, a reflection’s highlight — by flattening a whole range of distinct values into one. Tone mapping instead compresses the top of the brightness range smoothly, preserving relative detail even as absolute brightness gets scaled down to fit the display.
What’s actually inside the metadata
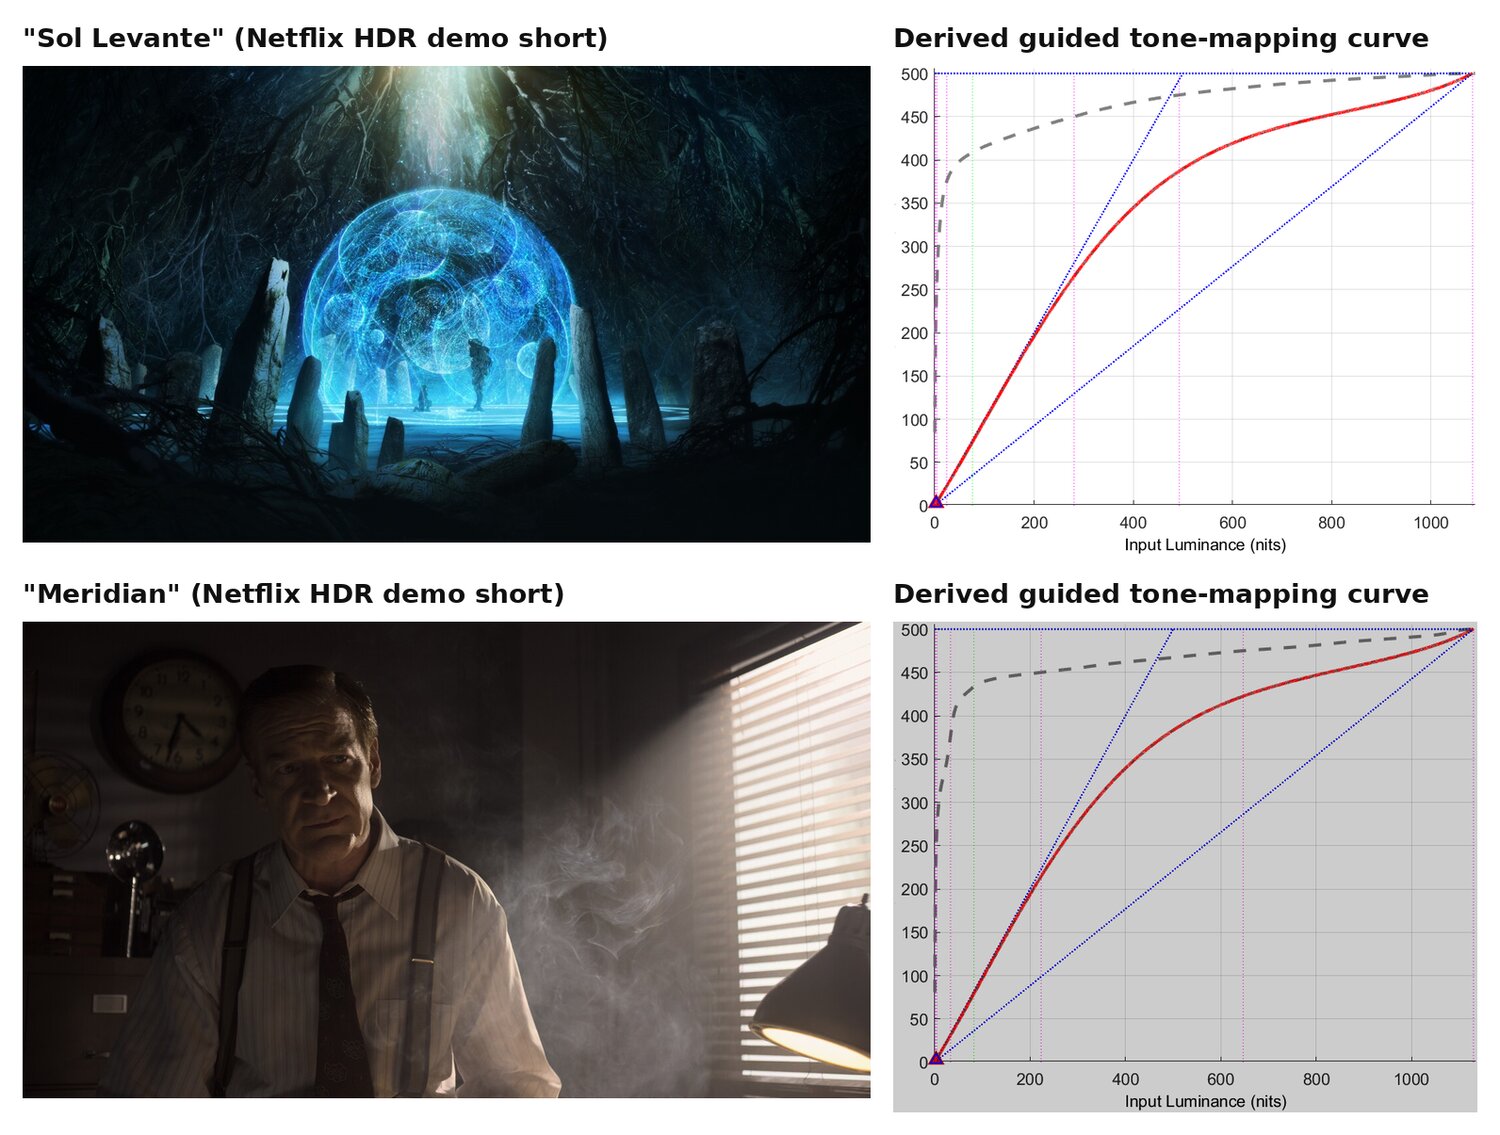
The reason HDR10+ can do this well is the depth of information it hands the display. For each scene, HDR10+’s dynamic metadata carries a statistical profile of the scene’s actual brightness distribution — essentially, what percentage of pixels fall at or below any given brightness level, across the whole range from darkest shadow to brightest highlight. That’s a far richer input than a single “brightest pixel” number: it tells a display not just how bright a scene gets, but how much of the image lives in the shadows, the midtones, and the highlights.
That statistical detail is what makes a precise, scene-specific tone-mapping curve possible in the first place — a curve shaped by what’s actually in that scene, built for that display’s own peak brightness, rather than a generic formula applied everywhere.
Static vs. dynamic: one curve for everything, or one per scene
The simplest tone-mapping systems use a single, fixed curve for an entire program — calculated once, based on the single brightest moment across the whole runtime. That’s workable, but it’s a compromise: a curve tuned to handle one very bright scene will under-use the display’s range during every dimmer scene that follows. HDR10+’s dynamic metadata instead gives the display fresh statistics for each individual scene, so the resulting curve is tailored to what’s actually on screen rather than to the most extreme moment in the whole film.
Global vs. local: one curve per frame, or several
Standard tone mapping — static or dynamic — still applies one curve across an entire frame. HDR10+ ADVANCED’s Local Tone Mapping goes a step further, letting a display apply different curves to different regions of the same frame, so a bright sky and a dark foreground in the same shot can each get treatment suited to their own content instead of splitting the difference.
HDR10+ ADVANCED: even more detailed statistics
HDR10+ ADVANCED extends the same underlying idea by capturing brightness statistics at far more points across the distribution — from the 1st percentile up to the 99.98th percentile, instead of a handful of broad markers. That extra resolution gives displays a more precise picture of exactly where detail sits in a scene’s darkest shadows and brightest highlights, enabling still more refined tone-mapping decisions on today’s highest-peak-brightness displays.
Independent confirmation
ScreenResolutionTest’s explainer on HDR tone mapping notes that the core function is to intelligently compress brightness values so that highlights remain bright, shadows retain detail, and mid-tones look natural — and specifically calls out dynamic tone mapping as superior to static because it adjusts luminance and contrast scene by scene rather than applying one fixed setting for an entire program, the same distinction that separates HDR10 from HDR10+.
Read ScreenResolutionTest’s full explainer on HDR tone mapping for more detail.